
Are your sales declining, but you don’t know why? Analyse four key performance indicators to identify where you are losing revenue before resorting to discounts.
Sales decline at a glance
- A sales decline is a reduction in revenue lasting at least two consecutive periods compared with the same period last year. One weak month is a fluctuation, not a decline.
- Revenue can be broken down into four numbers: customer traffic, conversion rate, average basket value and purchase frequency. The biggest change points to the cause.
- A decline often comes from regular customers shopping less frequently, rather than customers leaving altogether.
- An anonymous receipt shows how much revenue has fallen. Identifying customers through a loyalty card shows who is shopping less often.
- Discounts for everyone rarely solve the problem. A targeted message to the right customers, measured against a control group, addresses it directly.
The monthly report shows revenue is down 12.5% compared with last year. The first reaction is almost always the same: a promotion, 20% off, a poster in the shop window and an Instagram post.
And that’s where the problem begins.
A sales decline is a symptom, not a diagnosis.
The same drop in revenue could mean customers have switched to a competitor, their purchasing power has fallen, products are missing from your shelves or your best customers are simply visiting less often. Whether a discount makes sense depends on the cause. For some causes, it is entirely the wrong move.
The most common misconception is that falling sales mean fewer new customers. So businesses increase advertising first. But breaking the decline down by customer often reveals a different picture: new customer numbers are roughly unchanged, while existing customers quietly start visiting less often. No complaints. No defining moment. They simply come every three weeks instead of every two.
This article is a diagnostic guide: how to recognise a real decline, identify its cause and respond where you are actually losing money.
What Is a Sales Decline, and What Is Just a Seasonal Fluctuation?
A sales decline is a reduction in revenue lasting at least two consecutive periods, measured against the same period last year, rather than the previous month.
One weak month that fits the usual seasonal pattern is not a decline. It is a fluctuation and does not call for urgent changes.
January is almost always weaker than December. July in a city shop is often weaker than June. Compare those months consecutively, and every year you will “discover” a crisis that isn’t there.
|
Indicator |
Fluctuation |
Actual sales decline |
|
Duration |
One month or reporting period |
Two or more consecutive periods |
|
Comparison with last year |
Roughly unchanged |
Worse |
|
Number of transactions |
Stable |
Falls alongside revenue |
|
Seasonal pattern |
Matches previous years |
Decline occurs when it normally wouldn’t |
|
Channels |
Issue limited to one channel |
Decline across all channels |
How Do You Calculate a Revenue Decline?
The formula is simple: (last year’s revenue − this year’s revenue) ÷ last year’s revenue × 100.
If a shop generated $ 2,400,000 in the same quarter last year and $ 2,100,000 this year, revenue has fallen by 12.5%.
But that is the nominal decline.
If your prices have increased by around 5% in the meantime, revenue adjusted for that increase is approximately $ 2,100,000 ÷ 1.05 = $ 2,000,000. The real decline is then close to 17%. In other words, you are selling less merchandise than the revenue figures suggest.
Why Do Sales Fall? External and Internal Causes
Sales fall because of external factors you cannot control—seasonality, purchasing power, new competition and regulations—or internal factors you are responsible for: pricing, product range, stock availability, service, presentation and marketing.
The quickest check: if your competitors’ sales are also falling, the cause is probably external. If theirs are growing while yours are falling, look within your business.
External Causes of a Sales Decline
- Seasonality and the calendar: holidays, summer breaks and the start of the school year.
- Purchasing power: customers don’t stop shopping; they choose cheaper options and shop less often.
- New competition: a chain opening nearby, an aggressive online store or a marketplace.
- Changes in the surrounding area: roadworks or the closure of a neighbouring business that used to bring foot traffic.
Internal Causes of a Sales Decline
- Pricing that no longer offers competitive value.
- Stock availability: the product a customer wants is not on the shelf when they arrive.
- A product range that is outdated or contains too many overlapping options.
- Service and staff: a different shift, new employees or less effective recommendations at checkout.
- Marketing: a channel being discontinued, a reduced budget or the same messages being sent to everyone.
- Technical issues: a broken website form, a slow checkout or incorrect opening hours on Google Maps.
Let’s be honest: an external cause is the more comfortable explanation. That’s why you should check it last, not first.
Four Numbers That Explain Every Sales Decline
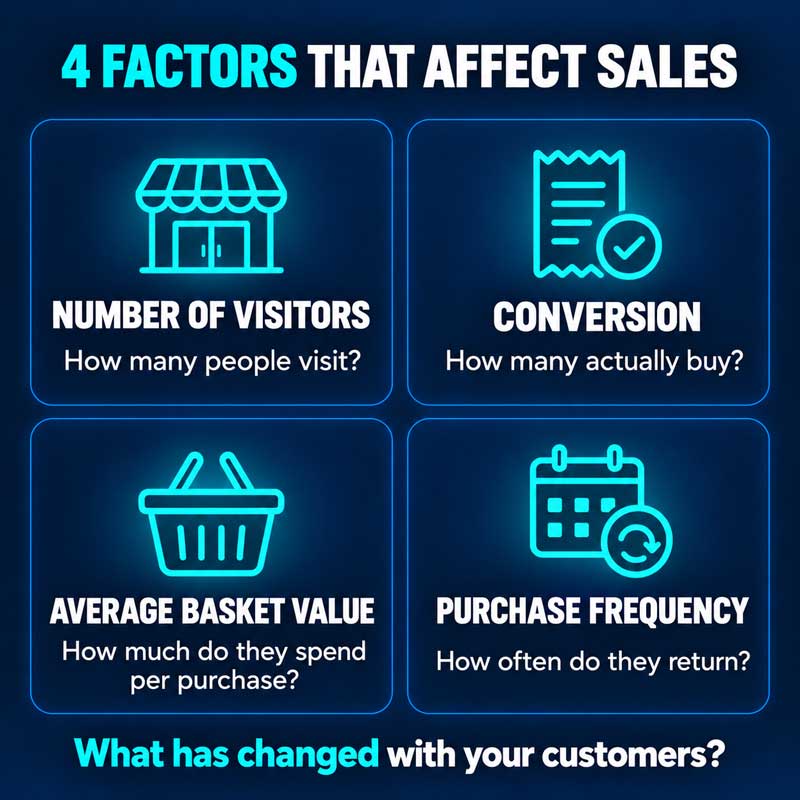
Revenue is the product of four numbers: customer traffic, conversion rate—the proportion of visitors who buy—average basket value and purchase frequency. When sales fall, compare each with the same period last year. The biggest change points to the cause.
|
Metric |
Physical shop |
Online store |
Hospitality |
|
Customer traffic |
Shop visits |
Website visits |
Guests per day |
|
Conversion rate |
Share of visits resulting in a purchase |
Share of visits resulting in an order |
Reservations that turn into visits |
|
Average basket value |
Transaction value |
Order value |
Average bill per table |
|
Purchase frequency |
Purchases per customer during a period |
Repeat orders |
Repeat visits |
Falling customer traffic points towards visibility, location and advertising.
A lower conversion rate points towards pricing, stock availability and service.
A smaller basket points towards your product range and recommendations at checkout.
Lower purchase frequency points towards your relationship with existing customers.
When Revenue Stays Flat but Transaction Numbers Fall
This is the most dangerous scenario because everything appears to be fine. You have raised prices by 10%, transaction numbers have fallen by 9%, and revenue in dinars is almost unchanged.
In reality, you are losing customers, and higher prices are temporarily masking it.
The good news is that you already have access to this signal. Every cash register in Serbia issues electronic fiscal receipts, so you can track daily and weekly transaction numbers without any additional tools. Monitor them alongside revenue, not instead of it.
A Sales Decline Has a Name
All four numbers in the previous section are averages. Averages tell you how much sales have fallen. They don’t tell you which customers are behind the decline.
And a sales decline doesn’t happen to “the market”. It happens through individual people.
Take the same shop: $ 2,400,000 last year, $ 2,100,000 this year—a loss of $ 300,000. Breaking that change down by customer produces the following “revenue bridge”:
- Lost customers—those who bought last year but haven’t bought this year: −$ 120,000
- Customers shopping less frequently—those who still buy, but less often: −$ 190,000
- Smaller baskets among customers visiting just as often: −$ 40,000
- New customers: +$ 50,000
Total: −$ 300,000.
Why does this change the picture? Because more than half of the gross revenue loss came from around 140 regular customers who haven’t left. They simply visit less often.
A campaign to attract new customers does not solve that problem.
A discount for everyone addresses it expensively and indiscriminately.
A message to those specific customers, at the right time, addresses it directly.
Here’s the catch: an anonymous fiscal receipt cannot produce this revenue bridge. It records the amount and the items, but not who made the purchase. Without customer identification, every transaction looks like a new customer, so you cannot distinguish someone who has left from someone shopping less often.
That is why a loyalty card is a source of data, not just a way to offer discounts. It links every transaction to a person, both in-store and online.
At this point, it makes sense to think in terms of a system rather than a spreadsheet.
The Spotlight platform brings together a loyalty programme, a customer database and automation in one place. Once transactions are linked to customers, you don’t have to export data manually and paste it into Excel to see who is visiting less often. The system tracks this continuously, so you can identify the people behind the sales decline while there is still time to stop it.
Early Warning Signs: How Can You Spot a Decline Before It Reaches the Report?
By the time a sales decline appears in your monthly report, it is already costing you money. Early warning signs show up in customer behaviour: longer gaps between purchases, your best customers moving into the “at-risk” segment, a lower share of repeat purchases and fewer items per transaction. These metrics shift weeks or months before revenue does.
The most useful signals are the interval between purchases and purchase frequency. A customer who used to visit every nine days but now comes every sixteen barely registers in your revenue figures. If this happens to a hundred customers at once, it will become noticeable in three months—and by then, it is too late.
The second signal is movement between customer segments. With RFM segmentation, you group customers according to how recently they purchased, how often they buy and how much they spend. Don’t just track how many “VIP customers” you have. Track how many moved into the “at-risk” segment this month.
That shift is a sales decline in the making.
The third and fourth signals are simple: the share of revenue generated by customers who also bought last month, and the number of items per transaction. Both fall before total revenue does.
Realistically, you cannot track any of these signals manually across several thousand customers. A spreadsheet captures one moment in time, while the interval between purchases changes every day.
What Should You Do in the First 14 Days After Sales Fall?
During the first two weeks, the goal is to identify one real cause and avoid spending your budget on the wrong assumption, rather than immediately increasing sales.
The plan is to gather data, break down the decline, separate external from internal causes, speak to customers who have stopped buying, check the competition and develop one hypothesis to test.
- Days 1–3: data. Gather monthly revenue, transaction numbers and average transaction value for the past two years. Compare with the same period last year.
- Days 4–5: breakdown. Analyse the four numbers, then build a revenue bridge by customer if you can identify individual customers.
- Days 6–7: external or internal. Check trends in your sector, technical faults and stock availability for your best-selling products.
- Days 8–10: customers. Contact ten to twenty customers who have started buying less often or stopped buying altogether. Use a short conversation or a message with one question, rather than a survey.
- Days 11–12: competition. Find out what has changed over the past three to six months: prices, new openings and promotions.
- Days 13–14: hypothesis. Choose one cause, one test and a clear measure of success.
If you see the revenue decline as part of a broader growth problem, it is also useful to explore how to improve sales once the diagnosis is complete. First the cause, then the tactic.
Why Shouldn’t a Discount Be Your First Response to Falling Sales?
A discount is the quickest move, which is why it is the most common. But a discount for everyone has a built-in flaw: you also give it to customers who would have bought anyway. If the problem is regular customers shopping less often, you have paid for purchases from people you haven’t lost, without reaching those you are losing.
Before lowering prices, check the obvious. Is the product on the shelf when the customer arrives? Does a competitor offer more for the same money? Could a bundle of two related products give the customer a reason to buy without reducing the base price? Sometimes the problem is not “too expensive”, but “I don’t see a reason to buy”.
If price really is the cause, change it because the data supports that decision, not simply because sales have fallen.
The second part of the problem is measurement. You send a campaign to customers shopping less frequently, some return, and you conclude that the campaign worked. But would they have returned without it?
A control group provides the answer.
Around 10% of customers in the same segment receive no message. If 18% of the messaged group return, compared with 11% of the control group, the actual campaign effect is seven percentage points, not 18. Without a control group, you are measuring luck rather than impact.
Why is this worth the effort? Because customer retention has a disproportionately large impact on profit. In practice, this only works if you respond in time. With automated campaigns, a customer who exceeds their usual purchase interval automatically receives a Viber message, SMS or email, without waiting for someone to notice it in a report.
When Is a Sales Decline Actually Not a Problem?
Not every revenue decline is bad. Sometimes it is the result of a good decision.
You removed products whose margins didn’t even cover storage costs. You raised prices and lost some customers who only shopped during promotions, but your margins improved. Last year, you received a large one-off order that will not be repeated. In all these cases, revenue falls while the business becomes healthier.
That is why you should look at profit, as well as revenue. And look at which customers you are losing.
Revenue is unevenly distributed, and profit even more so. An Ipsos analysis states that the most profitable 20% of customers generate 150–300% of total profit, while the least profitable 20% reduce it.
In other words, losing revenue from customers who were costing you money can be a relief. Losing revenue from your ten best customers is a warning sign, even when it barely registers in your total revenue.
What Are the Most Common Mistakes When Sales Fall?
The most common mistakes are comparing with the previous month instead of the same period last year, tracking revenue without transaction numbers, making several changes at once, cutting marketing and looking for someone to blame before identifying the cause. Each either hides the real cause or prevents you from finding out what helped.
All these mistakes share the same root: reacting before diagnosing.
Frequently Asked Questions About Falling Sales
Does a Sales Decline Always Mean Customers Are Switching to Competitors?
No. Customers often haven’t switched anywhere; they are reducing spending or shopping less frequently because of their own budgets. Switching to competitors is more likely if their revenue is growing during the same period while yours is falling.
Should You Reduce Your Marketing Budget When Sales Fall?
Cutting the budget usually accelerates the decline because it also shuts down channels that were working. A better approach is to redirect part of the budget from attracting new customers to retaining existing ones, especially those who have started shopping less frequently.
How Quickly Can You Realistically Stop a Sales Decline?
Diagnosis takes around two weeks, and the first results of a targeted response usually appear within one or two customer purchase cycles. For a shop people visit weekly, that means weeks. For a category purchased once a quarter, it means months.
Can a Loyalty Programme Help if Pricing Is the Cause?
It cannot compensate for prices that are significantly above the market. It can show which customers are price-sensitive, allowing you to send a targeted offer only to them instead of reducing prices for everyone.
Can a Small Shop Track Customer Data Without an Expensive System?
It can start with basic metrics: transaction numbers, average transaction value and a list of regular customers. Once customer numbers exceed a few hundred, manually tracking purchase intervals becomes unrealistic, so a system that does it automatically is needed.
A sales decline is more than a number. It raises three questions: which customers, since when and why?
The four numbers tell you where to look. A revenue bridge by customer tells you whom to contact. Early warning signs give you time to act before the decline reaches the report.
If all you have are anonymous receipts, you can see that sales have fallen. If you can identify customers, you can see who is shopping less often and contact them this week, rather than next quarter.
That is why it makes sense to build customer loyalty as a system rather than an occasional promotion.
The Spotlight marketing platform connects loyalty cards, customer data and automated messages for both physical shops and online stores. It is not an instant solution: customers need to be registered in the system, and the messages need to be relevant. But once it is running, falling sales stop being a surprise in the monthly report.