
Loyalty program performance metrics are not the number of cards issued or points distributed to customers — they are the numbers that show whether customer behavior is actually changing.
Eight metrics provide almost all the information you need: enrollment rate, activation rate, engagement, retention, reward redemption, CLV, incremental margin, and ROI. Without a control group for comparison, even these numbers can be misleading.
A loyalty program has been running for months. Cards have been distributed, points are being collected, and the app has users. Yet when someone asks in a meeting, “Is the program actually making money?”, the answer is often silence or something along the lines of “People are using it, so they seem to like it.”
That is not an answer. It is a guess with nice packaging.
Loyalty program performance metrics exist to replace gut feeling with numbers that can be verified, compared, and defended in front of an owner or director. The problem is not that companies track nothing. The problem is that they track the wrong things: the number of cards issued, app installations, or SMS messages sent.
Those are activities, not results.
Let’s clear up one misconception immediately: a high number of members does not mean a successful program.
A member who joins and never makes another purchase using the card is a row in a database, not a loyal customer. The real picture comes from eight metrics that, together, show whether the program changes customer behavior — and whether that behavioral change generates more money than the program costs.
Which Metrics Actually Show Whether a Loyalty Program Works
Eight metrics tell almost the entire story of loyalty program performance:
- enrollment rate,
- activation rate,
- engagement and purchase frequency,
- customer retention rate,
- churn rate,
- reward redemption rate,
- customer lifetime value (CLV),
- incremental margin and ROI, which translate all of this into money.
Each answers a different question. Enrollment rate tells you whether people want to join in the first place. Activation and engagement tell you whether they behave differently once they do. Retention and churn show how long they stay. Reward redemption shows whether the program delivers what it promises. CLV and ROI tell you whether it is all worth the cost.
No single metric tells the whole story.
High activation with low retention means the program attracts attention but fails to build a habit.
High retention with low reward redemption may mean customers stay out of habit rather than because of the program — useful information, but probably not the result you expected.
Enrollment Rate and Activation Rate: Two Different Metrics That Are Often Confused
Enrollment rate measures the percentage of customers who join the program at all. Activation rate measures the percentage of those enrolled customers who actually do something with it — make their first purchase using the card or redeem points for the first time. In practice, these two are constantly treated as the same metric, even though they are not.
How to calculate them: enrollment rate = (number of members / total number of customers) × 100. Activation rate = (number of members with at least one transaction within a defined period / total number of members) × 100.
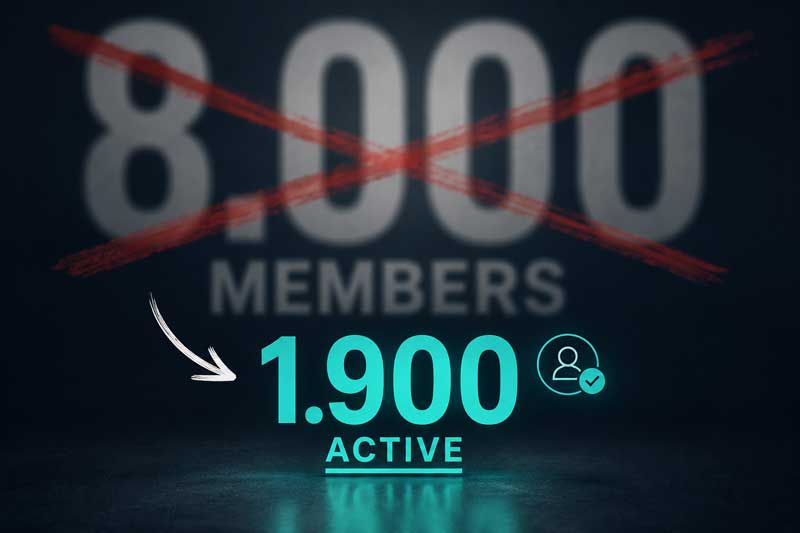
Example: You have a customer base of 8,000 people, and 3,200 join the program — an enrollment rate of 40%, which is a solid result. Healthy programs typically reach 40–60% enrollment among existing customers during the first year. But of those 3,200 members, only 1,900 make at least one purchase using the card within the next three months — an activation rate of 59%. That means 41% of your “members” exist only on paper.
Why this matters: a company that tracks enrollment alone celebrates 3,200 new members, while the actual number of people whose behavior the program is influencing is 1,900. The gap between those two numbers is the difference between a report that looks good and one that is accurate.
Engagement and Purchase Frequency: A Sign That the Program Is Changing Behavior
Engagement and purchase frequency show whether an activated member actually becomes a more frequent customer or simply occasionally redeems points when convenient. This is one of the metrics that most directly answers whether the program is doing what it was created to do.
It is measured as the average number of purchases per member during a defined period, compared with the same figure for customers who are not part of the program.
If a member purchases an average of 2.4 times per quarter while a non-member purchases 1.1 times, the program is clearly changing purchasing frequency — rather than merely rewarding behavior that already existed.
This is where many companies hit a wall. Purchase frequency is difficult to track without a system that connects every transaction to the same customer, regardless of whether they buy online, in-store, or through an app. Tracking this manually for thousands of customers is practically impossible — by the time the report is ready, the period it describes has already passed. That is why this metric is typically tracked through marketing automation connected to a customer database, rather than through a spreadsheet someone updates once a month.
Customer Retention Rate and Churn Rate
Customer retention rate measures the percentage of customers who remain active over time. Churn rate is its counterpart — it measures the percentage who stop purchasing. Together, these metrics show whether the program builds a long-term relationship or merely short-term interest.
How to calculate them: retention rate = (number of retained customers at the end of the period / number of customers at the beginning of the period) × 100. Churn rate = 100% − retention rate, or directly: (number of lost customers / number of customers at the beginning of the period) × 100.
Example: At the beginning of the year, you have 5,000 active members. By the end of the year, 4,100 are still purchasing regularly — a retention rate of 82% and a churn rate of 18%. By comparison, retention among customers outside the program is typically lower because they have fewer reasons to return specifically to you when the same discount is available elsewhere.
Why this is probably the most important metric on the list: acquiring a new customer costs more than retaining an existing one, and the difference is significant. A loyalty program that does not improve retention compared with customers outside the program is essentially failing at its primary job — regardless of how good it looks inside the app. That is why building customer loyalty is not a side effect of a loyalty program. It is its core purpose.
Reward Redemption and Points Liability: When Rewards Become a Cost
Reward redemption rate measures the percentage of earned points or rewards that customers actually use. A healthy range is between 60% and 80%. Below that, rewards may be too difficult to reach or not attractive enough. Above that, the program’s margin may be set too low.
How to calculate it: (number of redeemed rewards / number of awarded rewards available for redemption) × 100. Example: Of 3,200 members who have enough points for at least one reward, 2,100 redeem one during the quarter — a redemption rate of 66%, within the healthy range.
What rarely gets discussed is that every unredeemed point is not just a statistic, but a financial obligation carried by the company — known as “points liability.” If you have 40 million unredeemed points worth, for example, RSD 400,000, that is not an insignificant figure on the books — it is a liability that must be planned for because those points could eventually be redeemed at once.
CLV, Incremental Margin and ROI — and Why the Numbers Lie Without a Control Group
CLV, or customer lifetime value, calculates how much money one customer generates throughout their entire relationship with your business. Incremental margin measures the difference in spending between members and non-members. ROI compares all of this against the cost of the program and provides the final answer: does it pay off?
CLV: average purchase value × number of purchases per year × average customer lifespan in years.
Example: A member with an average basket value of $ 2,850, who makes eight purchases per year and remains loyal for three years, has a CLV of $ 68,400. A non-member with an average basket of $ 1,900 and four purchases per year, with a lifespan of one and a half years, has a CLV of $ 11,400. The difference of almost $ 57,000 per customer represents the additional value the program creates — if the program is actually responsible for creating it.
And this is where the problem begins — one that few people ask about openly. Customers who join a loyalty program are often already your best customers: people who would continue purchasing from you even without points because they already like your product or service. If you compare only members with non-members, the program gets credit for loyalty that existed before the program itself.
The solution is simple in theory and more difficult in practice: you need a control group — a group of customers with similar characteristics who are deliberately excluded from the program, or enrolled later, so their behavior can be compared with members during the same period. The difference that remains after that comparison represents the program’s true incremental contribution — not the member’s entire CLV, but only the part the program actually adds. Without this check, an ROI report can look excellent while actually measuring customers who would have purchased from you anyway.
This is where most companies hit another wall: calculating all of this manually in spreadsheets for thousands of customers and multiple segments is practically impossible. By the time the report is assembled, the data is already outdated. A system such as Spotlight automatically tracks spending, purchase frequency, and the behavior of each customer across all channels.
The point is not to have another dashboard. The point is to make sure the numbers you rely on actually measure what you claim they measure.
How Can a Physical Store Measure All of This in Real Time, Without Excel Spreadsheets?
Everything above may sound like a task designed for an online store with Google Analytics running in the background. In reality, a large share of loyalty programs in Serbia — pharmacies, cafés, retail stores, and restaurants — operate in physical locations, at the checkout, where there is no automatic digital trail unless a system actively records it.
And this is where the biggest difference lies compared with the way these metrics are usually discussed: a physical loyalty card is not merely a discount gimmick at the checkout. It can be a source of the same kind of data available to the most sophisticated online store — provided the card is connected to a system that records every transaction, rather than simply recording that the card was issued.
Every card scan at the checkout becomes an automatic entry in the same database used to calculate activation rate, purchase frequency, retention, and CLV — without anyone manually copying receipt data into a spreadsheet at the end of the day.
This also changes what you can realistically track. Instead of waiting for a quarterly report that arrives too late to change anything, a store owner or marketing manager can see at any moment who the active members are, who has started purchasing less frequently, and how many rewards are waiting to be redeemed.
Loyalty cards connected to a system that tracks these metrics turn the checkout from a place where transactions are simply processed into a place where every relevant data point is automatically recorded — and that is the difference between a program that “looks like it works” and one you actually know is working.
FAQ: Common Questions About Loyalty Program Performance Metrics
What Is a “Good” Enrollment Rate for a Loyalty Program?
Healthy programs typically reach an enrollment rate of 40–60% among existing customers during their first year. Below that range, it is worth checking whether the benefits of the program are being communicated clearly enough at the point of purchase.
How Exactly Is CLV (Customer Lifetime Value) Calculated?
CLV is calculated by multiplying the average value of a single purchase by the number of purchases per year and the average number of years a customer remains active. The result represents the total revenue one customer generates throughout their entire relationship with the business, rather than from a single purchase.
What Is “Points Liability” and Why Does It Matter?
Points liability is the total value of points that customers have earned but have not yet redeemed. Although it may seem like a minor detail, those points represent a financial obligation on the company’s books because they can be redeemed at any time. That is why loyalty programs need clear rules regarding point expiration.
How Often Should Loyalty Program Performance Metrics Be Tracked?
Core metrics such as activation and reward redemption make sense to track monthly, while retention and CLV are better evaluated quarterly or annually because changes in these metrics take longer to become visible. A system that automatically records transactions makes it possible to monitor all of these time periods simultaneously without additional manual work.
Should a Small Business With a Single Location Track All of These Metrics?
Not all at once. It makes sense to start with three core metrics — activation rate, purchase frequency, and retention rate — because they provide the fastest indication of whether the program is changing customer behavior. Other metrics, such as CLV and control-group-based ROI, become more useful once the customer base and data history are large enough to produce reliable results.
Together, these eight metrics provide a much more complete picture than any one of them individually.
Spotlight combines a customer database, loyalty program, and automation in one place, making these metrics available in real time for both online and physical retail — without guesswork and without waiting until the end of the quarter to find out whether the program is working.